
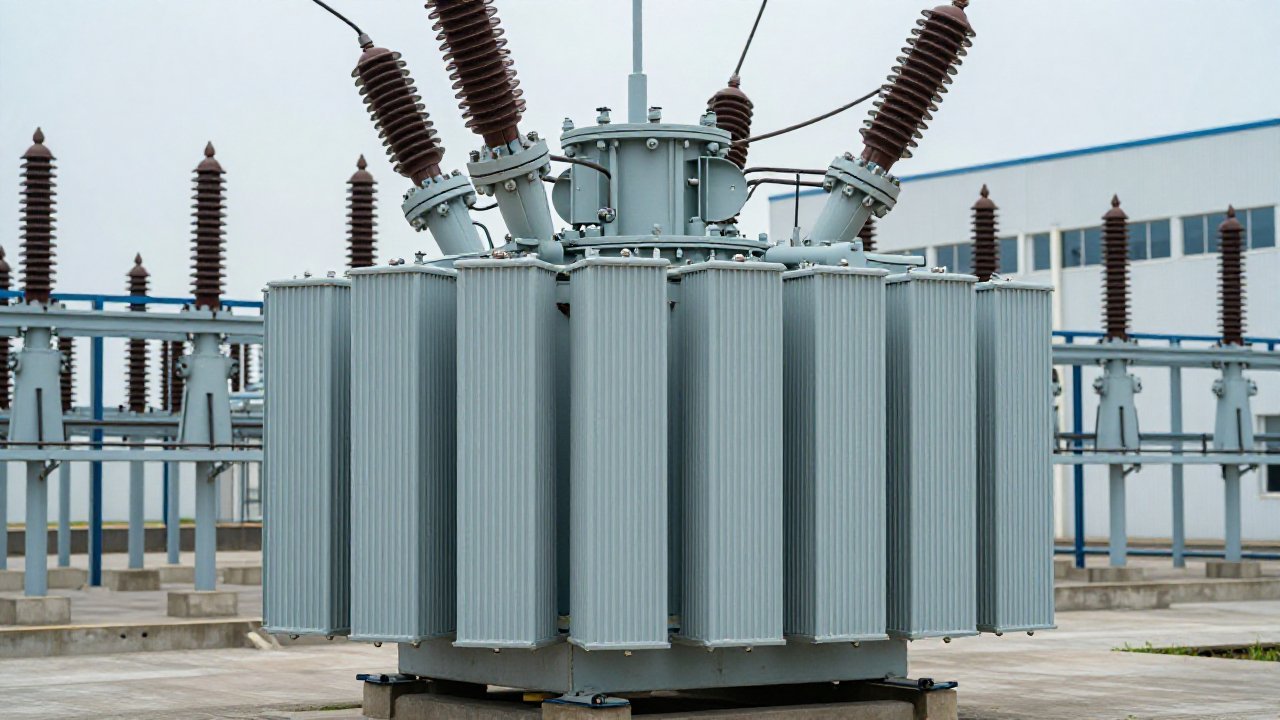
On 26 August 2026, a State Grid and Harbin University of Science and Technology team published a destructive test on a full-scale ±400 kV converter transformer with an artificial interturn defect (Tang et al., Energies 2026, 19(17), 4001). Six signal types recorded synchronously; high-frequency responded first, at about 1.9 minutes, the UHF and in-tank ultrasonic channels added evidence later, and the external channels were dominated by propagation path and noise. The authors declined to rank the sensors: that refusal is the point. Choosing among partial discharge detection methods is not a contest with a winner, since each is a different coupling path onto one event, and each is deaf to something.
Four methods, four physical quantities
A discharge releases its energy in nanoseconds as a current pulse, an electromagnetic wave and an acoustic wave, and which one a method listens to decides where its sensor can mount.
- UHF (ultra-high-frequency) senses radiated electromagnetic energy at 300–1500 MHz, confined by the tank as a lossy cavity.
- HFCT senses pulse current returning to earth through a grounding, neutral or cable-screen conductor, clamped at 0.3–30 MHz.
- AE senses the acoustic pressure wave on the external tank wall at 80–200 kHz.
- RF senses radiated radio frequency through an antenna or capacitive coupler.
What each method is blind to
| Method | Senses | Typical band | Mounting | Strength | Blind spot |
|---|---|---|---|---|---|
| UHF | Radiated energy in the tank | 300–1500 MHz | Oil valve or manhole | Low noise pickup | Only what reaches the coupler |
| HFCT | Pulse current in a grounded path | 0.3–30 MHz | Grounding or neutral clamp | Live-installable | Only current returning past the clamp |
| AE | Acoustic pressure wave | 80–200 kHz | External tank wall | Immune to electrical noise | Attenuated by oil and steel |
| RF | Radiated radio frequency | Broadband | Antenna near the asset | Screens a substation | Hears the substation's own noise |
Band figures above are vendor data; nothing there is a ranking. A coupler hears only what reaches it: the tank is a lossy cavity, the valve map is fixed, and every barrier costs energy at the leading edge. A clamp hears only current returning past it. An acoustic sensor sits behind metres of oil, pressboard and steel.
IEC TS 62478:2016, adopted in China as GB/T 42287, covers the non-conventional electromagnetic and acoustic measurement behind the online methods above; IEC 60270 remains the conventional laboratory reference, and DL/T 1498.1 addresses online monitoring devices. One boundary is easy to get wrong: IEEE C57.127 covers acoustic emission only and must never be cited for a UHF channel.
Frequently asked questions
Is one detection method more sensitive than the others?
No. Sensitivity belongs to the coupling path, not the transducer: a method that couples well on one unit can be attenuated on another.
The figure usually quoted, a minimum detectable apparent charge around 5 pC, is vendor data for a stated setup.
Can UHF, HFCT, acoustic and RF sensors share one instrument?
Yes; that is what a multi-input IED is for. The condition is a shared clock, with channels sampled together rather than read in sequence.
Why the answer is one instrument, several inputs
Correlation in time is what a single-method installation gives up, and most partial discharge detection methods can be compared this way. A pulse landing on a UHF channel and an HFCT channel within a few hundred nanoseconds is almost certainly a genuine internal discharge; the same burst on HFCT alone is more likely interference coupling into the grounding system. An acoustic arrival a fraction of a millisecond later is that same event, and none of these comparisons survives without a common time base.
Typical TPD-400 figures, all vendor data: 125 MS/s sampling at 14-bit, inter-channel synchronisation better than 100 ns, minimum detectable apparent charge about 5 pC, 600 kV lightning-impulse withstand, −30 to 60 °C, local cabinet. Pulses are stored as phase-resolved plots, covered in our PRPD and PRPS guide, and classified by an expert-system classifier that sorts defect type rather than certifying accuracy.
Detection is not location
Time-of-flight and time-difference measurements can assist location when several sensors at known coordinates share a nanosecond time base, but reflections and non-line-of-sight paths shift the leading edge timing depends on, and model error becomes position error. Treat a computed position as an aid to inspection planning, not a certificate; our guide to PD source location covers the error sources.
Which partial discharge detection methods belong on your transformers?
PAS DGA builds the TPD-400 online PD monitoring system, a multi-input industrial IED designed in line with IEC TS 62478 and GB/T 42287 for non-conventional PD measurement, DL/T 1498.1 for online monitoring devices, and IEC 61850 (DL/T 860) for substation communication. It answers what is discharging; dissolved gas analysis answers how the fault is developing, and the two are read together in PD versus DGA. The DGA-900 nine-gas analyser covers the gas side, with fleet rollout under power utilities.
Tell us which units you want to instrument and we will match sensor inputs to your failure modes.
Sources
- Tang, Y. et al. Development Characteristics of Winding Interturn Insulation Partial Discharge in a Full-Scale Converter Transformer. Energies 2026, 19(17), 4001, doi:10.3390/en19174001.
- IEC TS 62478:2016 (GB/T 42287 equivalent); IEC 60270; DL/T 1498.1; IEEE C57.127 (acoustic emission only); IEC 61850 (DL/T 860).
- TPD-400 figures: vendor data.