
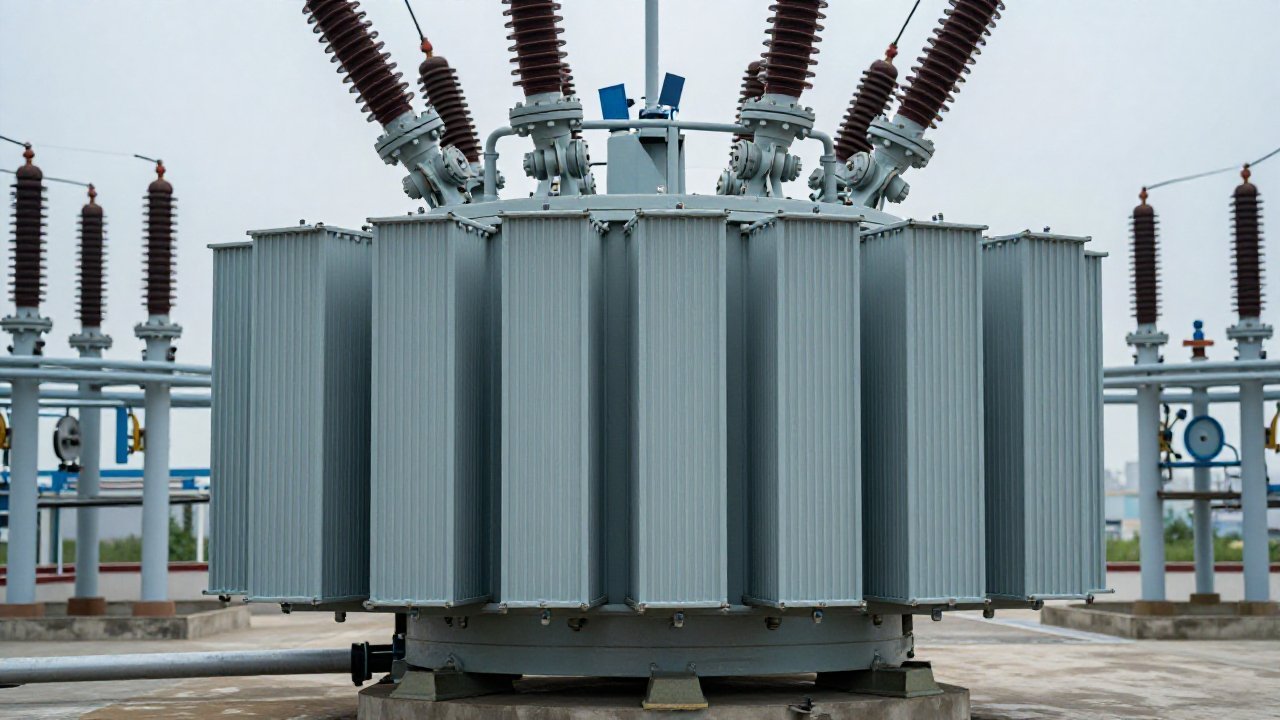
In September 2026 a Chinese power-software vendor announced two AI agents that read online oil-chromatography data against equipment ledgers and past alarm cases, aiming to return a diagnosis in seconds rather than a table of numbers. That month, Transformer Technology devoted its issue to insulation systems and the water–dissolved-gas relationship. Both point the same way: the interpretation layer keeps getting smarter, but it still consumes the same raw input — DGA gas ratios computed from a multi-gas measurement.
What a gas ratio actually tests
Fault gases do not rise independently. When insulation overheats or discharges, oil and paper break down into a predictable family of gases, and the proportions between them encode how hot the fault ran and how much energy it released. A thermal fault below roughly 300 °C produces mostly methane and ethane; hotter faults push the balance toward ethylene, and arcing adds acetylene (C2H2). Key-gas interpretation reads absolute concentrations. DGA gas ratios read the shape between them, so they travel better than a raw ppm figure — far less sensitive to oil volume, tank size and sampling dilution.
The three schemes you will meet in a lab report
Most laboratory software still codes the classic schemes, and a report that shows one usually shows all three.
| Scheme | Ratio set | What it maps | Practical note |
|---|---|---|---|
| Doernenburg | CH4/H2, C2H2/CH4, C2H4/C2H6 | Thermal decomposition, partial discharge, arcing | Needs at least one gas above a minimum level, or the sample cannot be judged at all |
| Rogers | CH4/H2, C2H4/CH4, C2H2/C2H4, with further codes added in later revisions | Normal, PD, arcing, and thermal faults in temperature bands | Still the workhorse in utility asset-management databases |
| IEC 60599 | CH4/H2, C2H2/C2H4, C2H4/C2H6 | The six fault types PD, D1, D2, T1, T2 and T3 | The version a standard-driven specification is written against |
The zone boundaries are public. What matters is which scheme a bid promises to implement, and what happens when a value lands outside every zone.
Where ratio methods break down — and what replaces them
Boundary cases. A value sitting on a zone edge can flip the diagnosis on a change smaller than the measurement uncertainty. IEC 60567:2023 puts laboratory sampling and analysis at roughly ±15 % overall, comfortably wide enough to move a borderline ratio from one zone into another.
Missing gases. If acetylene is below the analyser’s limit of detection, C2H2/C2H4 is undefined and the scheme cannot run at all — a real constraint for older mineral oils and for monitors with a high C2H2 floor.
Gases with no fault behind them. Some oils evolve hydrogen and methane at normal operating temperature with nothing wrong, which the industry handles under stray gassing and tests under ASTM D7150. A ratio built from those gases can point at partial discharge that does not exist. Ester-filled units add a further wrinkle: the zone boundaries were derived on mineral oil, and esters are now covered by dedicated guidance and by our note on ester transformers and IEC 63585.
The answer has been to stop betting on one method. In published research comparisons the key-gas method scores around 42 % and the Rogers ratio around 62 %, while the Duval triangle does materially better — about 95 % on Duval’s own 122-case comparison from the IEC TC 10 fault database, and typically 65–87 % in independent studies. The Duval pentagon ranks with the triangle among conventional methods, and multi-method voting or a machine-learning fusion of several features is reported between roughly 76 % and 98 %. Those are research comparison figures, not a product promise. They also explain why the September 2026 AI agents matter: a model consumes DGA gas ratios as features alongside rate of change, load history and past cases, and returns a ranked answer instead of a single box on a chart.
FAQ: Do machine learning methods replace DGA gas ratios?
No. The ratios remain the distilled physics of the problem, and most published classifiers still take ratio codes, concentrations and their rates of change as input. What changes is how evidence is combined and how quickly a user gets a ranked diagnosis. Ask a vendor what its model is fed with, whether it exposes the underlying ratios, and whether it can show its reasoning — a black-box fault type with no visible ratios is hard to defend in an asset-management review.
FAQ: What if a key gas falls below the detection limit?
Treat the ratio as unavailable rather than zero. Substituting zero produces a mathematically valid but meaningless result, and it is a common source of false arcing flags. Fall back on absolute concentrations, trends and rate of change until the gas clears the floor — which is why a 0.05 ppm acetylene detection limit is quoted, on vendor data, as a distinguishing specification rather than an abstract nicety.
Read the ratio, then verify the trend
Ratios tell you what kind of fault the gases resemble; they say nothing about how fast it is developing, so pair them with trend and rate-of-change logic. Designed on that principle, the DGA-900 nine-gas online monitor reports hydrogen, the hydrocarbon gases, carbon oxides and moisture continuously with a low C2H2 floor. Where the concern is early hydrogen rise before any ratio is computable, the dissolved hydrogen sensor range tracks it directly. The wider picture is in our Duval triangle guide, the hydrogen-first interpretation guide and the DGA fundamentals hub, with references on the standards page.
Talk to us about specifying continuous multi-gas monitoring for your transformers.