
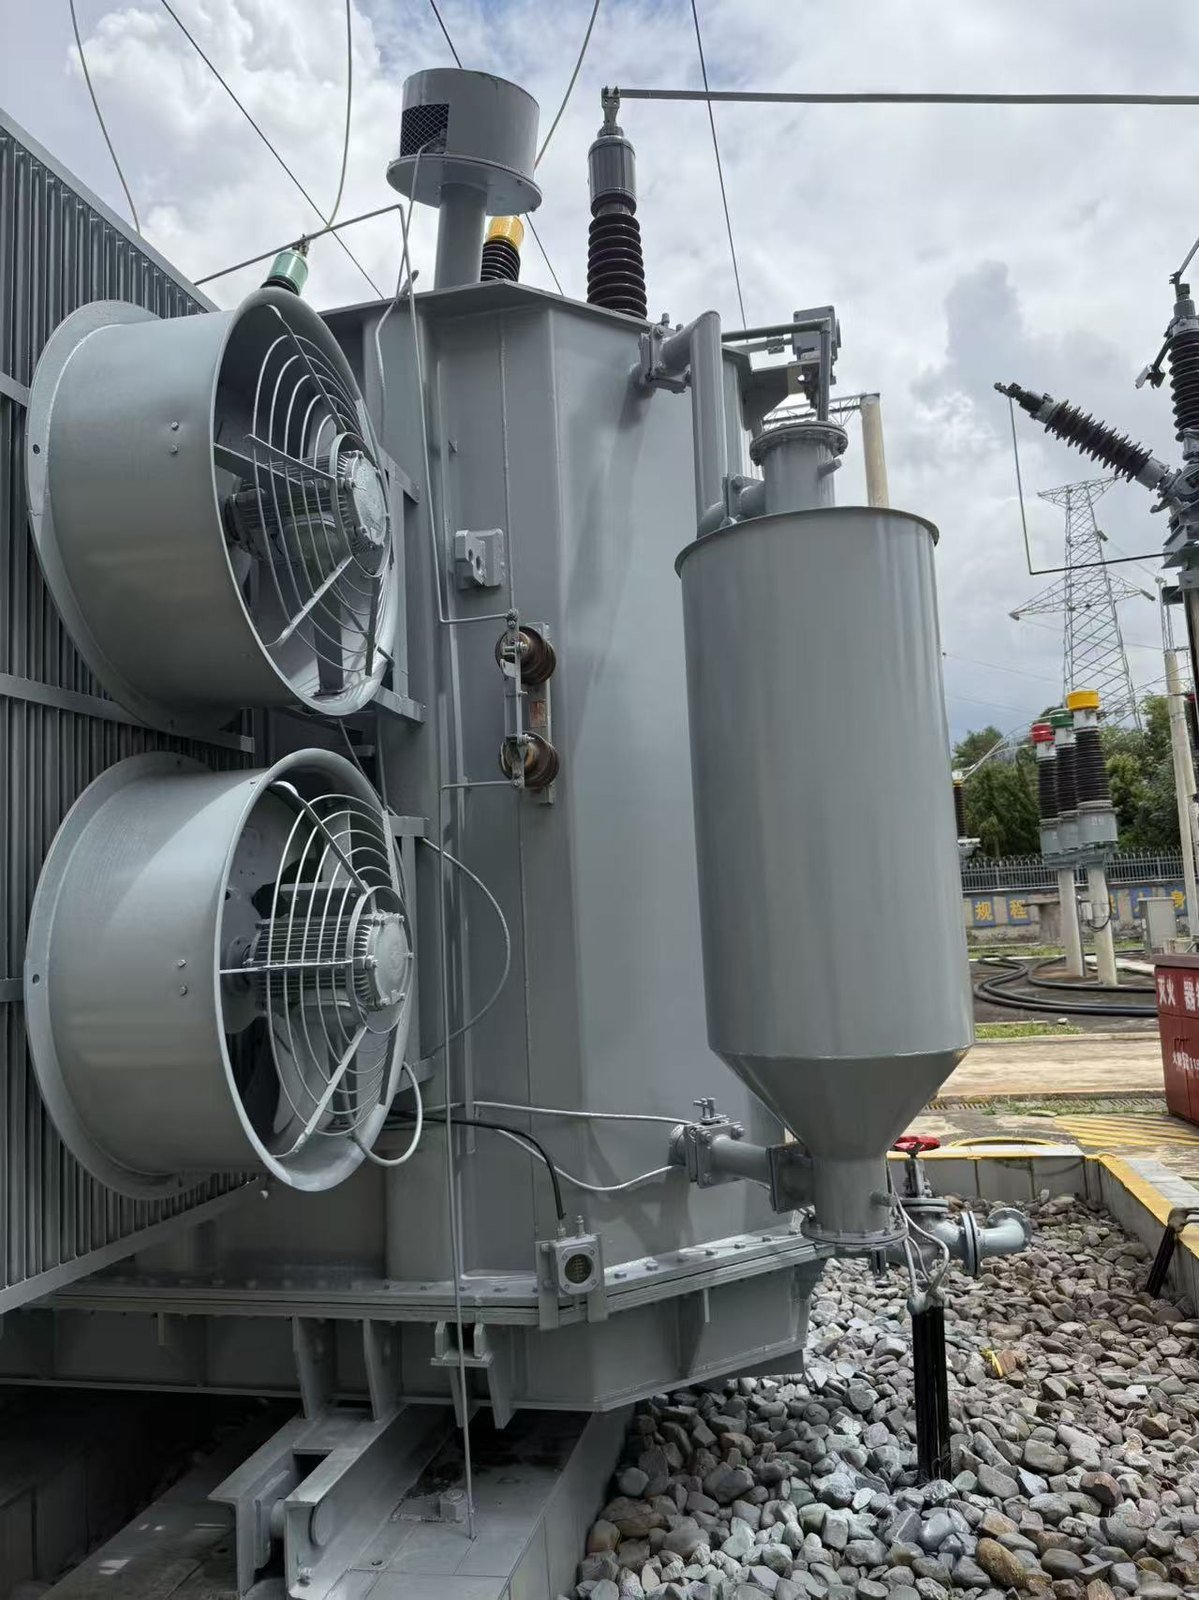
A photoacoustic gas monitor does one simple thing. Light is absorbed by a gas molecule and becomes heat; the heat expands the surrounding gas; the pressure wave that follows — sound — is picked up by a microphone or a quartz tuning fork. The family name is photoacoustic spectroscopy (PAS). What separates one photoacoustic DGA monitor from another is the light that does the exciting, and in dissolved gas analysis that choice has narrowed to two designs: a broadband thermal infrared emitter paired with optical filters, or a narrow-linewidth laser tuned onto the absorption line of each gas.
The two are often presented as a generation apart. In engineering terms they are better understood as two parallel ways of solving the same problem, each with a different cost and a different failure mode. This article sets out what the light source genuinely changes in a transformer DGA monitor, what it does not change, and how to turn the question into a written specification.
One principle, two light sources
Both routes reach the same photoacoustic cell. They differ in how a wavelength is chosen and how the light is switched on and off.
| Broadband infrared source | Narrow-linewidth laser | |
|---|---|---|
| Light source | Thermal emitter — blackbody, hot filament or a MEMS membrane — plus band-pass filters | DFB/DBR diode (near-infrared), or interband / quantum cascade laser (mid-infrared) |
| How a gas is selected | A filter wheel or filter array selects a band around that gas’s absorption feature | The laser is tuned onto that gas’s own absorption line |
| Modulation | Mechanical chopper in the classic form; electronic pulsing in modern emitters | Direct current modulation — no chopper |
| Detection cell | Non-resonant or resonant photoacoustic cell | Resonant cell, quartz tuning fork (QEPAS) or cantilever (CEPAS) |
| Heritage in gas analysis | The original method — Veingerov’s blackbody spectrometer, 1938 | Applied to transformer DGA from around 2011 |
Because the underlying measurement is the same, the two designs share the properties that define PAS as a family: no carrier gas and no columns, no chemical consumption, and a signal carried by sound rather than by a weak electrical current — which is why PAS instruments tolerate substation electromagnetic noise well.
What the light source actually changes
Selectivity
A laser excites one gas on its own absorption line, so cross-interference between gases with overlapping spectra is structurally lower than with a broadband source, whose filter passes a band rather than a line. That advantage is real but not absolute: a quantum cascade or interband cascade laser still has a finite tuning range and can alight near a neighbouring line, and water vapour is handled by choosing lines away from its absorption rather than by removing it. Broadband instruments compensate on the other side with filter choice, a reference cell and spectral deconvolution. Neither architecture is free of interference; they pay for it in different places (cross-sensitivity and selectivity in DGA sensors).
Adding gases
This is the sharpest practical difference. A broadband source serves many gases at once; adding a target gas is largely a matter of adding a filter. A laser instrument needs a laser per gas, or a broadly tunable source that covers a few of them, so the bill of materials grows with the gas count. This is why laser-based multi-gas instruments tend to be more expensive at nine gases than at two, while broadband instruments scale more gently — and why some suppliers offer laser detection for a few critical gases and a broadband or non-PAS channel for the rest.
Moving parts and modulation
The classic broadband design modulates the light with a mechanical chopper, and the chopper is the one wearing part in the optical path. Modern broadband emitters can be pulsed electronically instead, at some cost in signal; laser sources are modulated by their drive current and have no chopper at all. So the honest statement is that a chopper is a mechanical item whose service life must be written into the maintenance schedule, and that a laser instrument trades it for thermal control and wavelength locking electronics (how PAS instruments are built).
Cost shape
A broadband emitter is a commodity component. A tunable mid-infrared laser is the single most expensive part in the instrument, and it is also the part whose packaging sets the practical service interval. The consequence is not that one route is cheap and the other dear, but that their costs fall in different years: the broadband instrument carries more routine maintenance, the laser instrument carries more capital up front and a costly replaceable module later.
Where field accuracy is actually decided
If the light source is the part of a monitor that is easiest to describe, it is not the part that most affects the reading. A 2024 peer-reviewed review by M. Grisaru compared five PAS monitors against heated-headspace gas chromatography on 100 ppm and 500 ppm gas-in-oil standards and reported a mean deviation of about 3% for gas chromatography against about 24% for the PAS monitors, with the widest per-gas gaps on carbon dioxide and acetylene. The same work, comparing online PAS against online chromatography in service, found the largest divergence on hydrogen (about 59%) — a channel the photoacoustic cell does not measure directly at all. The study’s own conclusion was that PAS required improvements to match standard GC performance, and it named two parallel improvement routes: the light source, and the acoustic transducer. This is a research comparison, not a product claim, and it is quoted here because it points at where the error lives: the oil-to-gas stage and the calibration chain, not the optical source.
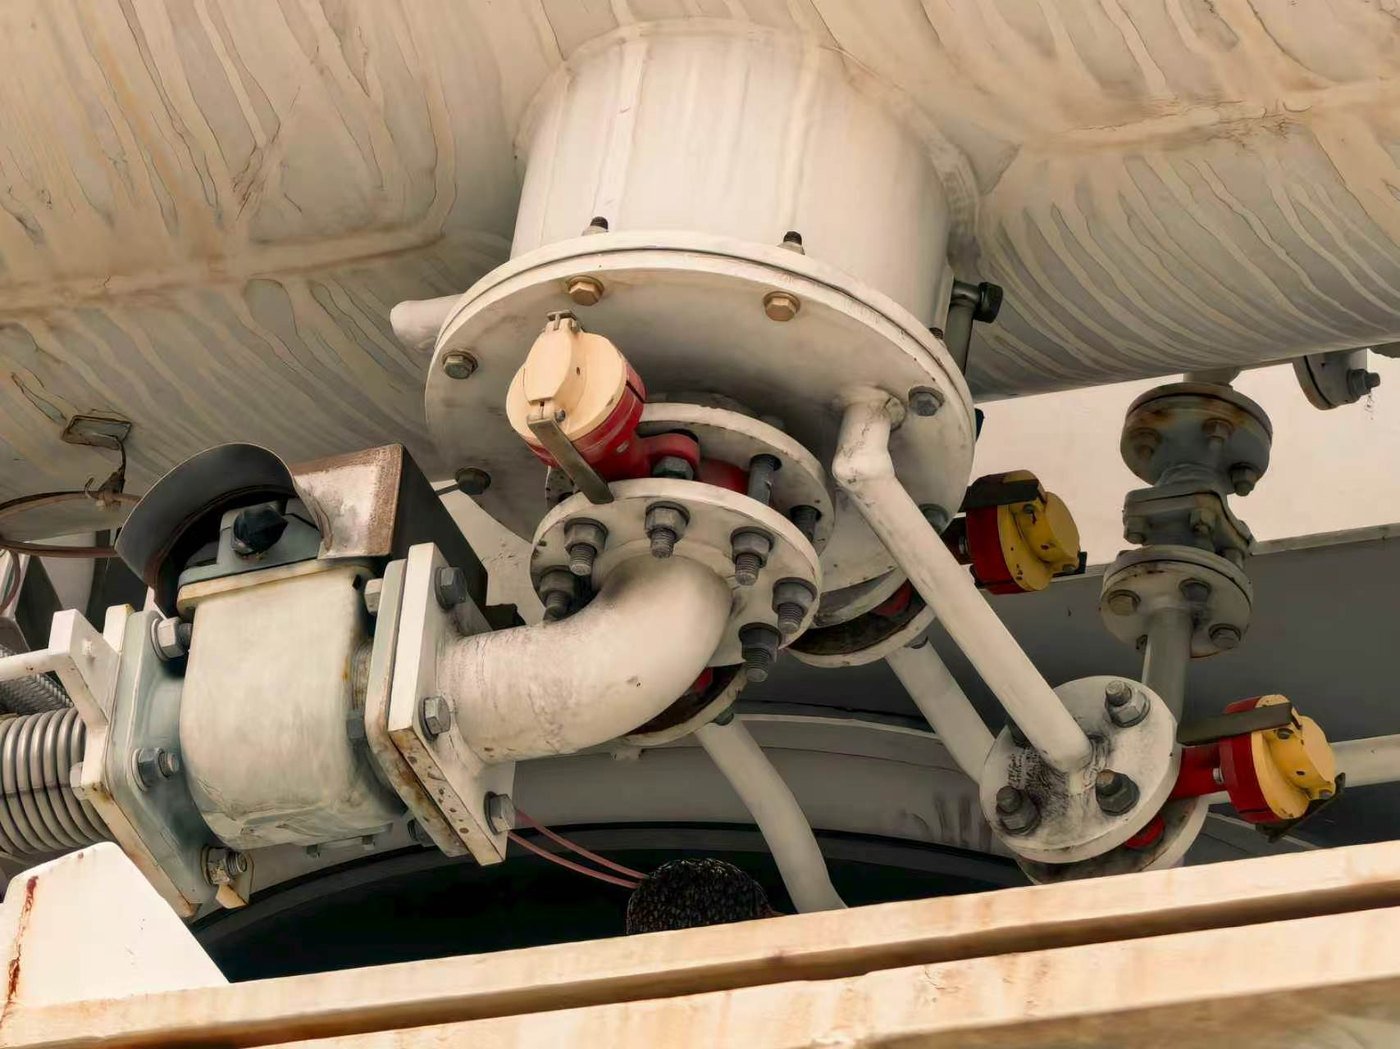
The lifecycle picture is similar. CIGRE TB 409 (2010) reported that online gas-monitoring instruments have a service life of at most half the transformer’s, and typically about a quarter — a reminder that the selection risk in this product class sits in consumables, calibration and whole-instrument reliability rather than in the light source. A separate, independent 15-year total-cost model presented by A. Hilgers at the Stuttgarter Hochspannungssymposium (2021) found that the instrument with the highest purchase price delivered the lowest total cost of ownership, because its running costs were lowest across three five-year segments. Both findings argue for scoring a monitor on its measurement uncertainty budget and its whole-life cost rather than on its light source alone.
The channel neither light source can reach
Hydrogen has no infrared absorption, so no photoacoustic cell — laser or broadband — can measure it. Every photoacoustic DGA instrument that reports hydrogen does so through a separate channel: thermal conductivity, electrochemical, or a solid-state sensor such as a palladium-alloy element. Oxygen and nitrogen behave the same way, and nitrogen is frequently a calculated rather than a measured value. This is not a defect of the laser route or the broadband route; it is molecular physics, and it means the gas count on a datasheet should always be read together with the delivery method behind each gas (why PAS cannot measure hydrogen).
How to turn the light-source question into a specification
The useful move is not to pick a side, but to make the supplier state the consequence of their choice. Ask the questions the light source actually governs, and require answers in writing.
| Question | What it tests |
|---|---|
| Which light source, and how many optical channels serve the required gases? | Whether the multi-gas count is served by one source or by several |
| C₂H₂ detection limit measured on transformer-oil matrix, not on dry standard gas | The number that matters for early discharge warning |
| Are there moving parts in the optical path, and what is their service interval? | Chopper or filter-wheel wear, and the maintenance it implies |
| How are H₂, O₂ and N₂ delivered, and what is the H₂ channel’s own accuracy? | Whether the hydrogen reading is measured or inferred |
| Quantified drift over 6–12 months, and the stated calibration interval | Whether the instrument holds its readings in service |
| Segmented consumable and spares schedule for years 0–5, 5–10 and 10–15 | Whole-life cost, which purchase price alone conceals |
Two monitors built on different light sources can both pass this test, and one built on the “newer” source can fail it. The light source is a design choice; the answers above are the evidence.
PAS DGA for online transformer gas monitoring
The PAS DGA range is built around this reasoning. At the multi-gas end, DGA-900 reports nine gases plus moisture for units where a fault type has to be named rather than merely detected. Where the need is a continuous hydrogen trend, the DGA-500 valve-mount monitor and the DGA-300 probe place a palladium-alloy element directly in the oil, and the hydrogen sensor family covers standalone and OEM duty, with the sensing-element basis set out in dissolved hydrogen sensor compliance. All PAS DGA instruments are supplied with the gas-to-oil handling matched to the site, since that is where the reading is decided. Send us the transformer ratings, the oil-circuit drawing and the gases you need to trend, and we will return a specification and an installation proposal — contact PAS DGA.
Sources
- M. Grisaru, “Photoacoustic method: The contemporary premier method for DGA,” Transformers Magazine 11(3):50–61 (2024) — peer-reviewed comparison; PAS vs GC-HS mean deviation ≈24% vs ≈3% on 100/500 ppm standards; online PAS vs online GC hydrogen divergence ≈59% (research comparison).
- CIGRE TB 783, DGA Monitoring Systems (2019) — DGA monitor classes and performance tables; Annex C (infrared types: PAS, NDIR, FTIR) and Annex D (gas chromatography).
- CIGRE TB 409, Report on Gas Monitors for Oil-Filled Electrical Equipment (2010) — online instrument service life at most half, typically about a quarter, of the transformer’s.
- A. Hilgers, “Überlegungen bei der Spezifizierung eines DGA Online-Monitoring-Geräts,” Stuttgarter Hochspannungssymposium 2021, pp. 109–127 — independent 15-year segmented cost model; highest purchase price yielded the lowest total cost of ownership.
- M. L. Veingerov (1938) — blackbody-based photoacoustic gas analysis, the origin of the method.
- Manufacturer specification data for photoacoustic DGA instruments, mid-infrared emitter lifetimes and laser module service intervals (vendor data), accessed 3 October 2026.
- IEC 60599:2022 (fault types); IEC 60567 (sampling and gas extraction); IEEE Std C57.104-2019 (Condition 1–4 ratings).