
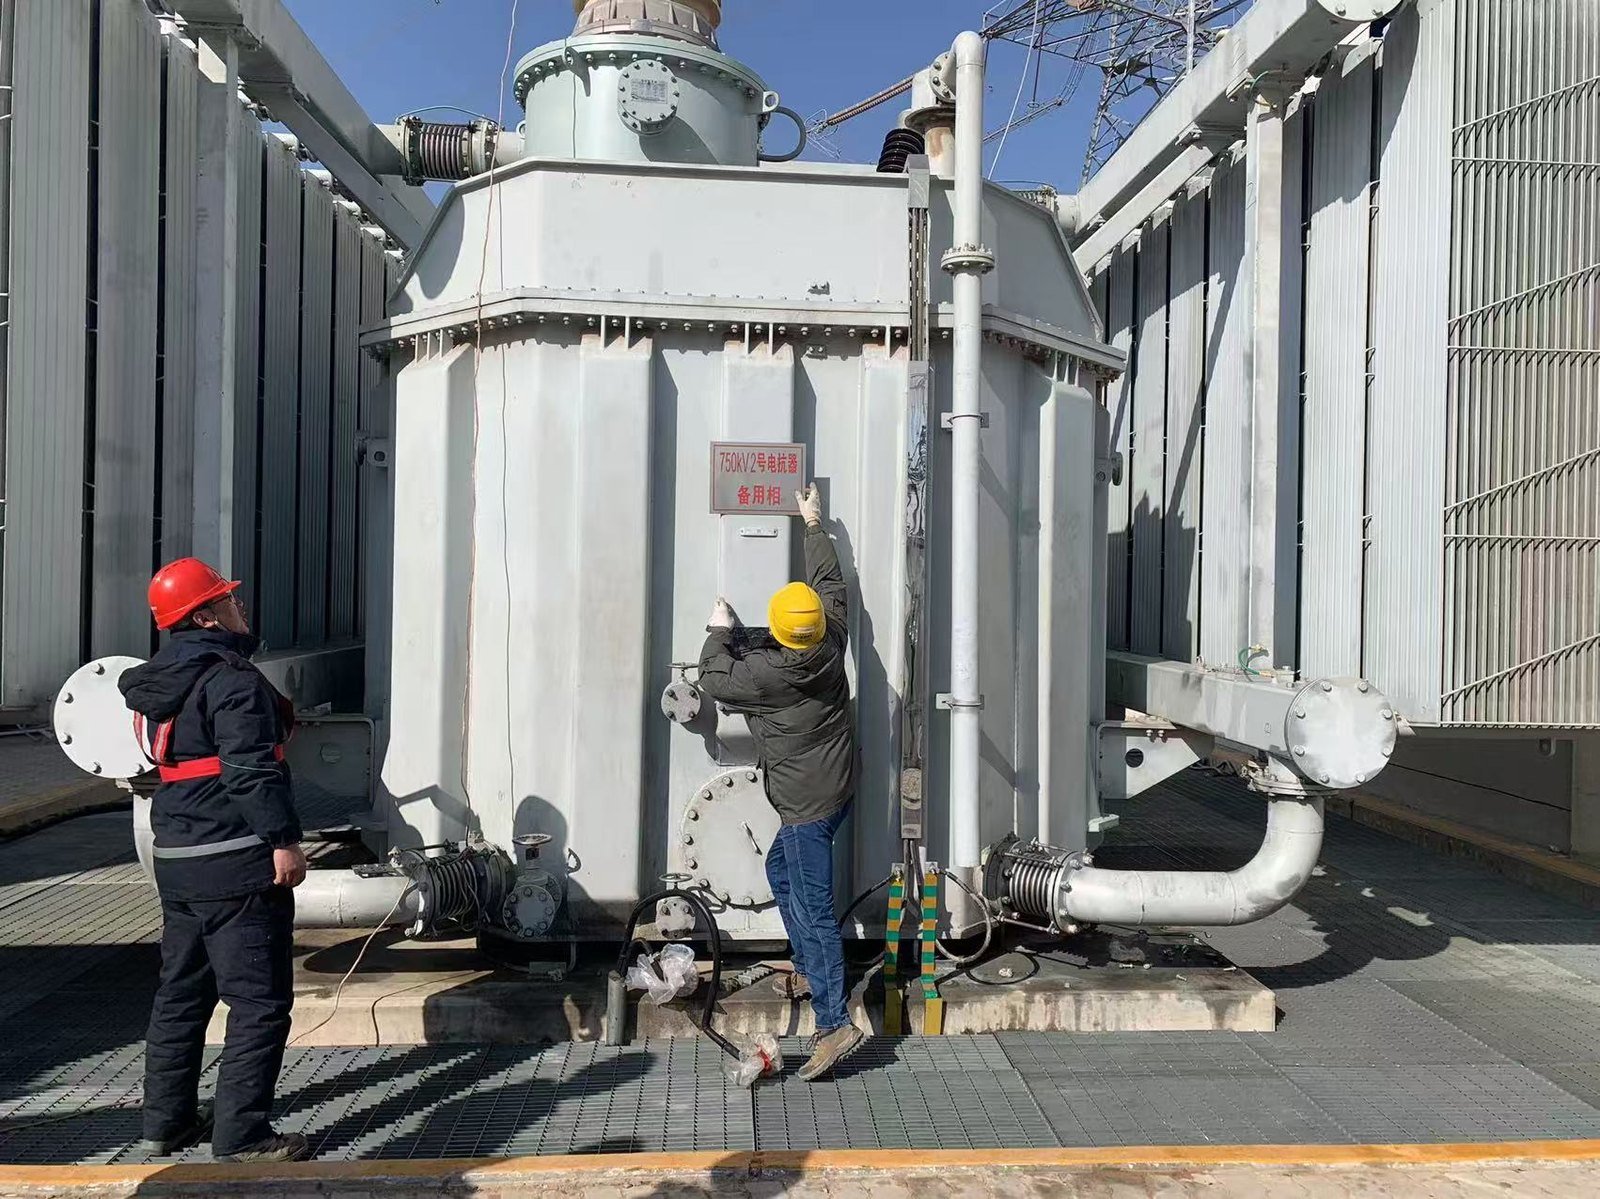
Every online DGA monitor on the market is sold with a specification sheet, and no two specification sheets are written to be compared. One quotes an acetylene detection limit measured on dry standard gas; another on oil. One lists nine gases; another lists nine gases and mentions in a footnote that three of them are inferred. Online DGA monitor selection goes wrong less often because a buyer chose the wrong instrument than because the competing instruments were never put on the same scale.
This article sets out a weighted scorecard you can fill in from documents the supplier already has, and pair with the interactive version at our DGA monitor selection tool. It borrows its structure from the evaluation dimensions used in utility tenders and from published third-party evidence on how these instruments actually behave in service.
Why a scorecard, and not a feature list
Three facts make a scorecard necessary. First, the light source — broadband infrared or laser — is an architecture choice, not a measure of quality; scoring a monitor on it alone rewards marketing rather than performance. Second, hydrogen, oxygen and nitrogen cannot be measured by a photoacoustic cell at all, so the gas count on a datasheet must be read together with the delivery method behind each gas. Third, and most important, the accuracy of an installed monitor is decided mainly by the oil-to-gas stage and the calibration chain, not by the detector. A 2024 peer-reviewed review comparing PAS monitors with heated-headspace gas chromatography on gas-in-oil standards found a mean deviation of about 24% for the PAS instruments against about 3% for the chromatograph, with the widest gaps on carbon dioxide and acetylene (research comparison, Grisaru). The lesson for a buyer is not that one technology wins, but that a monitor should be scored on the evidence of what it reads in oil.
The nine dimensions and their weights
Weight the dimensions so that the ones a datasheet hides carry the most points. The three heaviest — acetylene detection limit, long-term accuracy and degassing response — are also the three a supplier is least likely to volunteer.
| # | Dimension | Weight | Why it carries this weight |
|---|---|---|---|
| 1 | Field acetylene (C₂H₂) detection limit | 20% | The gas that warns of early discharge; catalogue figures are usually standard-gas, not oil-matrix |
| 2 | Long-term accuracy and drift (≥6 months vs laboratory GC) | 20% | The largest blind spot in the class, and rarely published |
| 3 | Oil–gas separation and response time (T63 / measurement cycle) | 15% | Sets the real ceiling on how fast a fault is caught |
| 4 | Gas coverage, including how H₂, O₂ and N₂ are delivered | 10% | Covers the diagnosis methods; the hydrogen channel must be scored separately |
| 5 | Selectivity and cross-interference (moisture, other gases) | 10% | Structural for lasers, but achieved by other means in broadband instruments |
| 6 | Whole-life cost over 15 years, segmented | 10% | Purchase price alone routinely misleads |
| 7 | Maintenance and moving parts | 5% | Choppers and filter wheels are wear items in some designs |
| 8 | Communications and integration | 5% | Station-bus fit — IEC 61850, IEC 60870-5-104, DNP3, Modbus |
| 9 | Certification and field track record | 5% | Certificates read against the parameters actually bid |
Dimensions 1 to 3 therefore carry 55% of the score, on the principle that they are where the monitoring value lies and where the evidence is thinnest.
How to score each dimension
Score each dimension from 0 to 5, and record the document that justifies the score. A score with no document behind it is a zero.
| Dimension | Evidence to demand | What earns a top score |
|---|---|---|
| 1 · C₂H₂ limit | Detection limit measured on transformer-oil matrix near the limit and at a typical fault level, ≥5 repeats each | Deviation within laboratory total uncertainty and repeatability RSD in the low single digits |
| 2 · Accuracy / drift | Installed comparison against offline gas chromatography over ≥3 cycles, then every 6 months; quantified drift figure | A published drift figure in ppm per month, not a qualitative “calibration-free” claim |
| 3 · Degassing / T63 | A written step-response (T63) figure from a gas–oil equilibrium test | A T63 consistent with the contract, with oil-temperature and pressure corrections stated |
| 4 · Gas coverage | The delivery method for every gas, with the H₂ channel’s own accuracy and lifetime | Hydrogen measured, not inferred; N₂ identified as calculated if it is |
| 5 · Selectivity | How interference is controlled — line selection, filters, reference cell, algorithm | A stated residual interference figure, not a claim of none |
| 6 · Whole-life cost | A segmented schedule for years 0–5, 5–10, 10–15: consumables, spares, calibration, licence, attendance | A model in the style of the Stuttgarter 15-year cost method |
| 7 · Maintenance | A list of moving parts and their service interval; consumables list | No wear items in the optical path, or an interval longer than the maintenance window |
| 8 · Integration | Protocols and conformance evidence for the station bus actually in use | Evidence of conformance testing at the level the substation requires |
| 9 · Certification | Certificate originals — test basis, parameters covered, validity | The certificate’s scope covers the parameters being bid |
The five items that should veto a bid
Some gaps are not trade-offs. Weighted scoring hides them, so treat the following as absolute:
- The bid cannot deliver hydrogen as a measured value, or offers it as a calculation.
- The supplier will not provide ≥6 months of field drift data or third-party test reports in original form.
- The field acetylene detection limit is above 0.5 ppm, which makes early discharge increments hard to catch.
- There is no written T63 or degassing-efficiency figure.
- A third-party certificate is offered whose scope does not cover the parameters being bid.
A worked comparison
Three anonymised bids, scored on the same 0–5 scale and weighted, show why the heaviest dimensions decide the outcome. Bid A leads on price and on gas count but has no oil-matrix acetylene figure and no drift data; Bid B is mid-priced, publishes drift and T63, and delivers hydrogen by a dedicated sensor; Bid C is the most expensive with the strongest evidence dossier.
| Dimension (weight) | Bid A | Bid B | Bid C |
|---|---|---|---|
| 1 · C₂H₂ field limit (20%) | 2 | 4 | 5 |
| 2 · Accuracy / drift (20%) | 1 | 4 | 5 |
| 3 · Degassing / T63 (15%) | 3 | 4 | 4 |
| 4 · Gas coverage (10%) | 5 | 4 | 5 |
| 5 · Selectivity (10%) | 3 | 4 | 5 |
| 6 · Whole-life cost (10%) | 4 | 4 | 3 |
| 7 · Maintenance (5%) | 4 | 4 | 4 |
| 8 · Integration (5%) | 4 | 4 | 4 |
| 9 · Certification (5%) | 3 | 4 | 5 |
| Weighted total | 2.65 | 4.00 | 4.60 |
Bid A’s wider gas list cannot rescue it, because the two heaviest dimensions — the acetylene figure and the drift evidence — are the ones it does not have. This is the pattern the weighted scorecard is designed to expose.
From score to shortlist
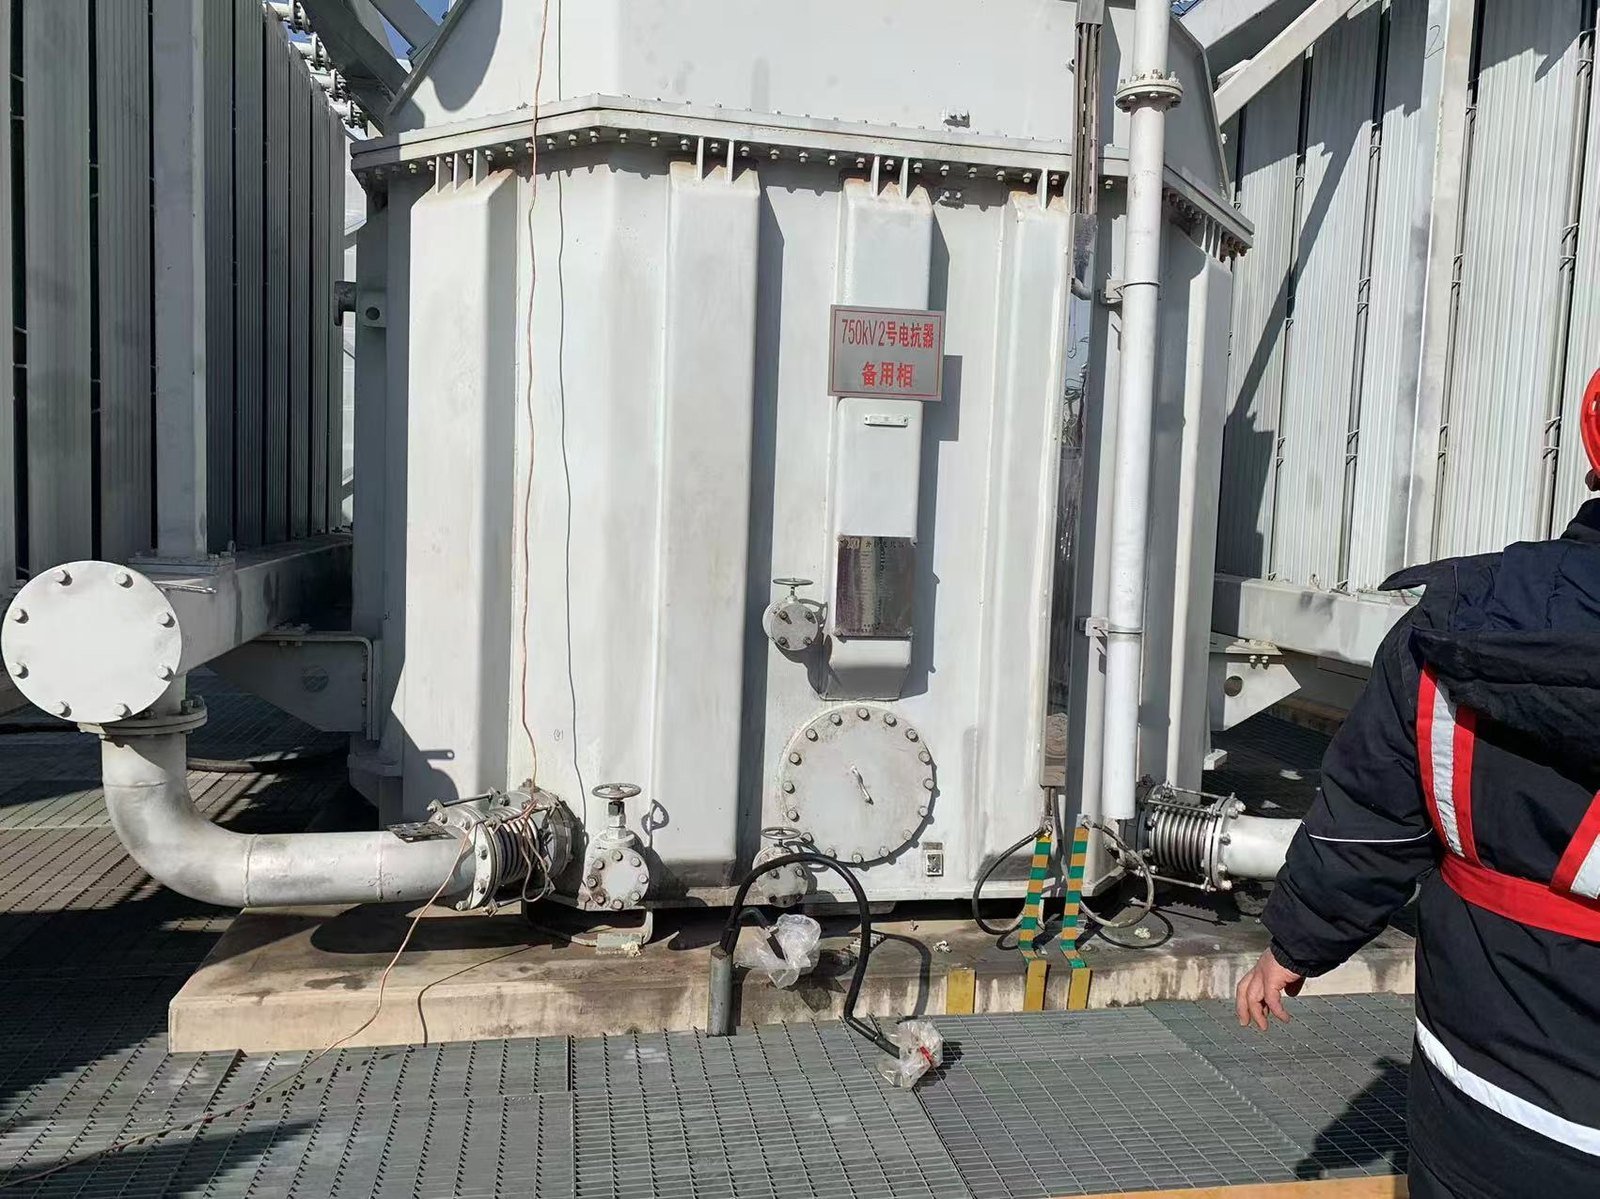
A score is a shortlisting device, not a verdict. Use it to drop the bids that fail the heaviest dimensions and the veto list, then verify the survivors with a trial: install against a laboratory comparison over the first three months, and hold final acceptance against the written T63 and the agreed deviation band. The purchase that scores best on paper is the one whose evidence you can still stand behind a year later.
PAS DGA for online transformer gas monitoring
If you are assembling a tender file, the PAS DGA range is supplied with the documents this scorecard asks for. DGA-900 reports nine gases plus moisture where a fault type must be named; the DGA-500 valve-mount monitor and DGA-300 probe place a palladium-alloy element directly in the oil for continuous hydrogen; and the hydrogen sensor family covers standalone and OEM duty. The sensing-element basis is set out in dissolved hydrogen sensor compliance, and fleet-level architecture in DGA monitoring for transformer fleets. Send us your evaluation criteria and we will answer them in writing — contact PAS DGA.
Sources
- M. Grisaru, “Photoacoustic method: The contemporary premier method for DGA,” Transformers Magazine 11(3):50–61 (2024) — PAS vs GC-HS mean deviation ≈24% vs ≈3% on 100/500 ppm standards (research comparison).
- CIGRE TB 783, DGA Monitoring Systems (2019) — monitor classes, detection-limit and accuracy tables; Annex C (infrared types) and Annex D (gas chromatography).
- CIGRE TB 409, Report on Gas Monitors for Oil-Filled Electrical Equipment (2010) — online instrument service life at most half, typically about a quarter, of the transformer’s.
- A. Hilgers, “Überlegungen bei der Spezifizierung eines DGA Online-Monitoring-Geräts,” Stuttgarter Hochspannungssymposium 2021, pp. 109–127 — 15-year segmented cost method.
- IEC 60599:2022 (fault types); IEC 60567 (sampling and gas extraction); IEEE Std C57.104-2019 (Condition 1–4 ratings); IEC 61850 (station bus).
- Manufacturer specification data for online DGA monitors and hydrogen channels (vendor data), accessed 3 October 2026.