
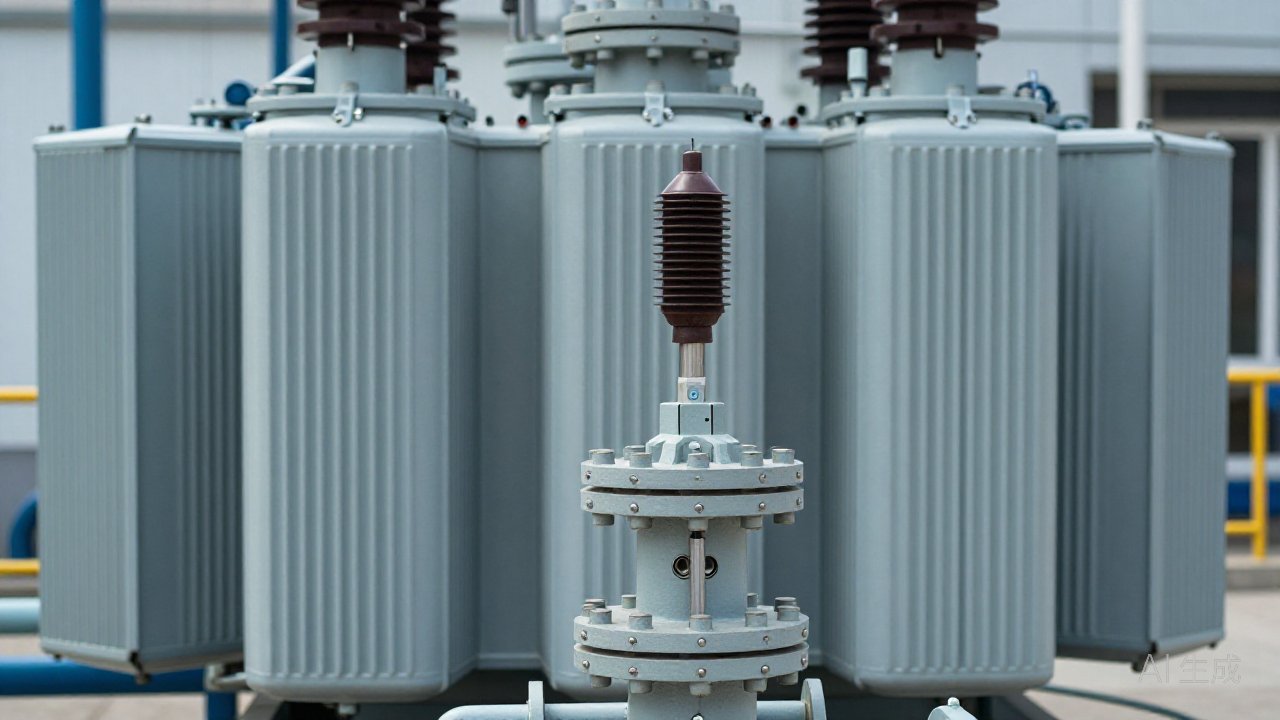
A transformer that has just been degassed, refilled after a repair, or given a full oil change comes back from the laboratory with fault-gas concentrations close to zero. That result is frequently read as a clean bill of health. It is not one. It is a new starting point, and the first months of DGA after oil treatment have to be read against a baseline that no longer exists. The fault, if there was one, was not removed with the oil.
Why the readings collapse after treatment
Vacuum degassing, oil replacement and reclamation all act on the same quantity: the gas dissolved in the oil. None of them removes gas that is adsorbed in the solid insulation, and none of them removes the defect that produced the gas in the first place. A unit that entered treatment with a hot spot and a hydrogen trend leaves treatment with the same hot spot and an empty oil reservoir. The treatment bought time and visibility, not a repair.
The first post-treatment sample becomes the reference value for years. Taken before the oil homogenises, it is not a valid reference at all, and the valve location decides which fraction of the tank the laboratory sees — see oil sampling point placement.
The paper is the reservoir the oil sample cannot show
Cellulose insulation holds gas and moisture in a way that oil does not. When the oil is degassed, the concentration gradient reverses: gas stored in paper moves back into the oil. This re-equilibration is slow and temperature-dependent. A mild, decelerating rise in carbon oxides — often with hydrogen — over the first weeks is the paper returning what the vacuum pump took, not necessarily a new fault.
A single post-treatment number is weak evidence; a sequence is strong, because the pattern rather than the level carries the diagnosis. Gas that returns in its pre-treatment ratios and then levels off is behaving like a residual; a gas that was absent before and appears afterwards is not.
What a post-treatment baseline must record
A baseline is only useful if later comparison is unambiguous. Record conditions alongside the numbers, or a later rise cannot be separated from a change in load or temperature.
| Item | Why it belongs in the baseline record |
|---|---|
| Date, time and sampling point | Rate of rise starts here; different valves see different oil |
| Load and top-oil temperature | Both move with operating temperature |
| All seven fault gases | A single hydrogen value cannot separate residual from new gas |
| Moisture, in ppm and %RS | Treatment shifts water partitioning more than gas |
| Treatment type and oil volume | Each leaves a different residual profile |
| Oil brand and type | Inhibited mineral, ester and silicone behave differently |
How to tell a residual rise from a new fault
Reading DGA after oil treatment is a comparison, not a reading. Three signals separate the two cases:
- Gas pattern. Residual gas returns in roughly its pre-treatment proportions, dominated by the gases the paper holds. A new fault introduces a gas the previous record never contained — acetylene is the clearest example, because it does not linger in cellulose as carbon oxides do.
- Shape of the trend. Re-equilibration decelerates as oil and paper approach equilibrium. A developing fault accelerates, or rises in step changes that follow load and tap-changer operations.
- Composition shift. If the ratios move rather than the absolute values, the source has changed. That is the point at which rate-of-rise analysis and the gas-ratio methods of IEC 60599:2022 in DGA gas ratios become more informative than any single concentration.
A less obvious post-treatment source is stray gassing from oil handled under the wrong conditions; it is covered in stray gassing in transformer oil.
How soon after oil degassing can DGA be sampled?
The first sample of DGA after oil treatment should wait until the oil homogenises, typically 24 to 72 hours after the unit returns to service, then follow at one week, two weeks, one month and three months. Any earlier sample is a check on treatment quality, not a baseline. Degassing also leaves oil and paper out of equilibrium, so a sample drawn in the first hours measures treated oil rather than the insulation system. With an online monitor fitted, the hourly trend separates residual decay from a fault rise long before the next laboratory result — the strongest argument for keeping sampling points and the monitor on the same oil circuit.
Does oil degassing remove the fault?
No. Degassing removes dissolved gas and temporarily improves dielectric margin, but it does not remove a hot spot, a loose connection or a discharge site. A rapid return of the same gas pattern is one of the strongest confirmations that the defect is still active, so the post-treatment trend deserves as much attention as the pre-treatment one.
The DGM-900 online monitoring platform measures fault gases and moisture on a configurable cycle, so the re-equilibration curve is captured continuously instead of inferred from four samples. The lab DGA versus online DGA comparison shows where each belongs, and the seven fault gases field guide explains what each gas is telling you. To discuss a baseline and trending scheme for a unit returning from treatment, contact the PAS DGA engineering team.